Reliable growth factor and cytokine protein recovery from the vial
is essential for reproducible results in stem cell culture.

If it looks like 100 μg of bioactive growth factor protein,
it should be 100 μg of bioactive protein.
Suppliers of highly bioactive proteins, such as growth factors and cytokines, have a fundamental role in determining the success of the stem cell and organoid culture protocols that rely entirely on these reagents. We feel that manufacturers and distributors of critical reagents should be held accountable for their contribution to inter and intra-lab variability in the success of stem cell maintenance and differentiation protocols.
As part of our Bioactivity Guarantee, we conduct comparative quantitative bioactivity studies with current dominant suppliers to ensure the bioactivity of our proteins is equivalent or better. Surprisingly, when we collated basic information from these studies, we observed large discrepancies in the recovery of proteins from the supplier vial across a wide range of proteins.
Antibody manufacturers were called upon to raise standards of validation and specificity nearly ten years ago now, sparked by the 2015 Nature article by Monya Baker “Reproducibility crisis: Blame it on the antibodies”.
When working with stem cell models, it is frequently critical to maintain the same concentration of protein in the culture media. In most stem cell labs, it is impossible to measure and correct for recombinant protein recovery from the vial, so you are reliant on your suppliers to set stringent criteria to minimize variability. Inconsistent growth factor concentration in media introduces uncertainty during protocol and process development and may contribute to the variability in stem cell culture differentiation protocol yields, which are often challenging to explain and troubleshoot, especially when several growth factors (cytokines) are used.
Using growth factors and cytokines in large excess is a common, albeit cost-intensive, approach, used to mitigate some of these impacts. However, this is not always successful due to the biological properties of some of these proteins, such as the morphogen Activin A – why quality is not just about purity. Here, the biological effect is dependent on the protein concentration and, therefore, must be specifically controlled during iPSC differentiation protocols.
Getting the simple things right is essential, not optional, in this field.
Stem cells are notoriously challenging to work with and variability in protein recovery is particularly problematic as it is not feasible in most stem cell labs to correct for the protein amount in the vial prior to making up media.
Accurate protein recovery improves inter and intra-lab reproducibility and prevents waste of time and budget.
Qkine is a scientist-led company, and several of us were scientists in those antibody companies that embraced the challenge of raising standards. We are committed to developing and manufacturing the highest quality bioactive proteins to improve scientific outcomes, enhance reproducibility, and reduce wasted research time and budget. All our products adhere to the Nine-point Qkine Quality Commitment and we test every lot of protein produced in a complete set of rigorous quality assays.
In our routine testing for recovery from the vial, we calculate the recovery of protein from sample vials selected at random after aliquoting and freeze-drying the protein using UV spectrophotometry. During our R&D process, we also define experimentally the correct reconstitution buffer for the specific protein. We provide this reconstitution solution free of charge to customers to make lab-life and media preparation as simple as possible. This ensures that we maintain an industry-leading vial recovery standard of 95%-115%, which is crucial to give scientists the confidence that they are using accurate final concentrations of bioactive protein in the culture media or in other applications.
a.
b.

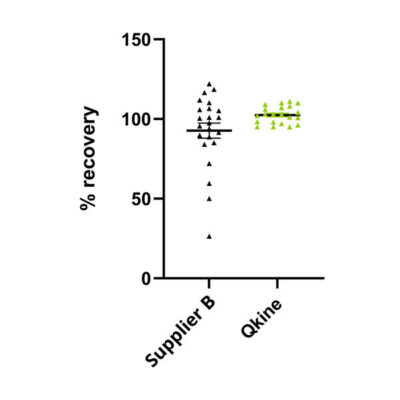
Figure 1. Quantification of protein recovery during comparative assays.
To ensure accuracy during bioassays that compare protein bioactivity, the protein was recovered from the vial either as recommended by the supplier or, for some proteins, using the Qkine experimentally determined reconstitution procedure (complete data set shown in a). If the reconstitution process used differed from Supplier B recommendations, these data were removed from the final analysis (b). Following reconstitution, from several matched proteins from Qkine or Supplier B protein concentration was determined using UV absorbance followed by calculation of protein recovery from the vial. The graph shows the UV recovery (%) between growth factors from Qkine (green) and Supplier B (black). Complete dataset from 23 different recombinant proteins from Supplier B and 23 proteins from Qkine (a). Complete data in the supplemental material below.
Getting the simple things right is important.
At Qkine, we are committed to raising the standard in bioactive protein manufacturing.
Our science team is here to help, please contact us if you have any questions at customerservice@qkine.com.
Supplemental data
Method
Growth factors from Qkine and Supplier B were reconstituted according to experimentally determined recommendations of Qkine growth factors. This includes reconstitution with water or 10 mM HCl. The UV absorbance was measured following reconstitution from the stock vial to determine the actual concentration and the percentage of protein recovery.
Results
| Growth factor | Qkine code | Unit size (μg) | Reconstitution volume (μl) | Reconstitution solution | Batch No. | Expected concentration (mg/ml) | Actual concentration (mg/ml) | Recovery (%) |
|---|---|---|---|---|---|---|---|---|
| Activin A | Qk001 | 25 | 25 | HCl | 204564 | 1 | 1.03 | 103 |
| BMP-2 | Qk007 | 25 | 25 | HCl | 204510 | 1 | 0.97 | 97 |
| BMP-4 | Qk038 | 25 | 25 | HCl | 204547 | 1 | 0.95 | 95 |
| EGF | Qk011 | 25 | 25 | HCl | 204576 | 1 | 0.981 | 98 |
| FGF-1 | Qk071 | 25 | 25 | Water | 204543 | 1 | 1.1 | 110 |
| FGF-10 | Qk003 | 25 | 25 | Water | 204578 | 1 | 1.03 | 103 |
| FGF-2 (145aa) | Qk025 | 25 | 25 | Water | 204544 | 1 | 1.1 | 110 |
| FGF-4 | Qk004 | 25 | 25 | Water | 204532 | 1 | 1.09 | 109 |
| FGF-8b | Qk057 | 25 | 25 | Water | 104458 | 1 | 0.962 | 96.2 |
| GDF-5 | Qk070 | 25 | 25 | HCl | 204571 | 1 | 0.95 | 95 |
| Gremlin 1 | Qk015 | 25 | 25 | HCl | 204555 | 1 | 1.03 | 103 |
| HGF | Qk013 | 25 | 25 | HCl | 104451 | 1 | 0.983 | 98.3 |
| LIF | Qk036 | 25 | 25 | HCl | 104477 | 1 | 1.008 | 100.8 |
| Noggin | Qk034 | 25 | 25 | HCl | 204542 | 1 | 1.04 | 104 |
| IGF-1 | Qk047 | 25 | 25 | Water | 204568 | 1 | 0.95 | 95 |
| IL-3 | Qk090 | 25 | 25 | HCl | 204548 | 1 | 1.01 | 101 |
| R-spondin 1 | Qk006 | 25 | 25 | HCl | 204574 | 1 | 1.06 | 106 |
| R-spondin 1 LR5 | Qk031 | 25 | 25 | HCl | 204499 | 1 | 1.11 | 111 |
| R-spondin 3 | Qk032 | 25 | 25 | HCl | 204563 | 1 | 1.02 | 102 |
| TGF-B1 PLUS | Qk010 | 25 | 25 | HCl | 204573 | 1 | 1.08 | 108 |
| FGF-2 | Qk002 | 25 | 25 | Water | 204528 | 1 | 1.07 | 107 |
Table 1 – UV recovery data from the reconstituted growth factors from Qkine.
Table summarizing the UV recovery results (%) for each growth factor and their catalog number, unit size, reconstitution volume and solution, batch number, expected concentration (mg/ml), and actual concentration (mg/ml).
| Growth factor | Unit size (μg) | Reconstitution volume (μL) | Reconstitution solution | Manufacturer recommended reconstitution solution | Expected concentration (mg/ml) | Actual concentration (mg/ml) | Recovery (%) |
|---|---|---|---|---|---|---|---|
| BMP-10* | 10 | 20 | HCl | Water | 0.5 | 0.559 | 111.8 |
| BMP-7 | 10 | 20 | Water | Water | 0.5 | 0.36 | 72.0 |
| DKK1 | 10 | 20 | Water | Water | 0.5 | 0.478 | 95.6 |
| FGF-1* | 50 | 50 | Water | 5 mM sodium phosphate | 1 | 0.596 | 59.6 |
| FGF-18 | 25 | 25 | Water | Water | 1 | 0.938 | 93.8 |
| FGF-8a | 25 | 25 | Water | Water | 1 | 0.5 | 50.0 |
| FGF-8b | 25 | 25 | Water | Water | 1 | 1.22 | 122.0 |
| GDF-2* | 10 | 20 | HCl | Water | 0.5 | 0.458 | 91.6 |
| GDF-5* | 50 | 50 | HCl | Water | 1 | 1.066 | 106.6 |
| GM-CSF | 5 | 25 | Water | Water | 0.2 | 0.2115 | 105.8 |
| LIF | 25 | 25 | Water | Water | 1 | 1.0085 | 100.9 |
| HRG* | 10 | 50 | HCl | Water | 0.2 | 0.237 | 118.5 |
| IL-1 B | 10 | 20 | Water | Water | 0.5 | 0.449 | 89.8 |
| IL-3 | 10 | 20 | Water | Water | 0.5 | 0.488 | 97.6 |
| IL-4 | 5 | 20 | Water | Water | 0.25 | 0.263 | 105.2 |
| IL-6 | 5 | 50 | Water | Water | 0.1 | 0.085 | 85.0 |
| M-CSF | 10 | 25 | Water | Water | 0.4 | 0.4035 | 100.9 |
| EGF | 100 | 100 | Water | Water | 1 | 0.887 | 88.7 |
| NGF | 20 | 25 | Water | Water | 0.8 | 0.933 | 116.6 |
| PDGF-BB | 50 | 50 | Water | Water | 1 | 1.102 | 110.2 |
| SCF | 10 | 20 | Water | Water | 0.5 | 0.502 | 100.4 |
| TGF-beta 2* | 10 | 20 | HCl | Water | 0.5 | 0.132 | 26.4 |
| TGF-beta 3* | 2 | 20 | HCl | 5-citric acid | 0.1 | 0.084 | 84.0 |
Table 2 – UV recovery data from the reconstituted growth factors from Supplier B.
Table summarizing the UV recovery results (%) for each growth factor and their unit size, reconstitution volume and solution, manufacturer recommended solution, expected concentration (mg/ml), and actual concentration (mg/ml).*Growth factors reconstituted following our scientific expertise instead of the manufacturer recommended reconstitution solution which were excluded from the final analysis.
