As a structural biologist, one will very quickly realise that protein that is suitable for structural and quantitative biophysical analyses not only needs to be pure, but it also needs to be homogeneous. A typical question one is asked, when providing a protein for someone to work on, is “How pure is the protein?” Usually, the answer one is expected to give is “better than 95%” or “99%”. Firstly, that is only one criteria one might use to assess the usefulness of a protein preparation for whatever one might need to do with it and hence one should never be satisfied with that alone as the answer. Secondly, the expected answer is also very unscientific. How do you define purity, especially for large, complex molecules like proteins? We can run 1 µg of protein in SDS-PAGE and stain with Coomassie Brilliant Blue R250 and show a single band. But given that sensitivity of that stain is in the regions of tens of nanograms, we would not be able to see contaminants that are at the level of a few percent of the preparation. There might be many proteins that contaminate the prep. Also, that method only reveals contaminating proteins. What about all the rest that can come from the expression host: DNA, RNA, lipids, carbohydrates,…?
So, we clearly need different criteria for defining the quality of the protein preparation, and that is what we do at Qkine.
SDS-PAGE is still a valid method, provided that a sufficient amount of protein is being analysed so contaminants can be detected. Also, when we are dealing with disulfide-rich proteins, it is important to think about how the samples are analysed. A “normal” way to run proteins is by reducing them with beta-mercaptoethanol or similar reducing agent to break all the disulfides. But what if your protein makes disulfide-mediated oligomers? Or the protein has mixed disulfides? All of these will be hidden in a reduced sample and therefore the only way to demonstrate purity is to use both reduced and non-reduced samples and suitable stains.
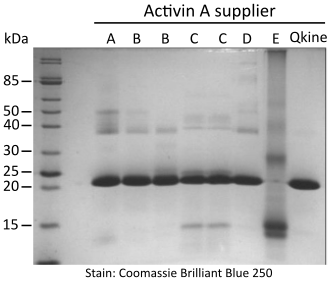
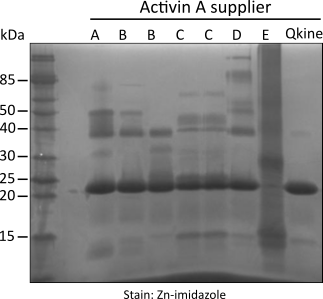
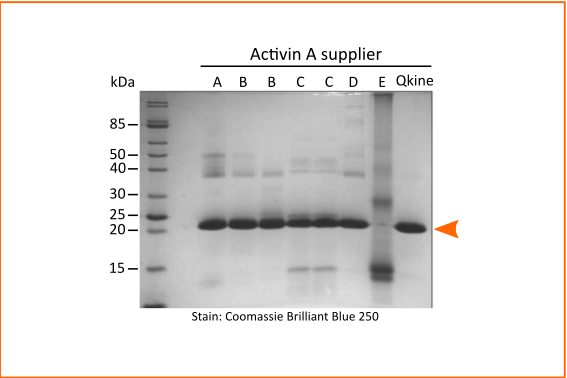
Figure 1. Non-reducing SDS-PAGE for detection of oligomers, protein contaminants and degradation products.
5 µg per sample was mixed with an equivalent volume of non-reducing loading buffer and run on a 15 % w/v SDS-PAGE gel. Gel on the left is stained with Coomassie Brilliant Blue R-250 and on the right with high sensitivity Zn-imidazole stain.
While SDS-PAGE can reveal contaminants that are significantly different in molecular weight, it is not able to reveal post-translational modifications or other microheterogeneity in a sample. Therefore mass spectrometry analysis is needed to complement the SDS-PAGE. For small proteins, this method can determine masses within 1 Da and can thus confirm not just the identity of the protein but also how many disulfides it has (as each disulfide formation removes two hydrogens from the protein, with -2 Da mass difference). Proteins expressed in E.coli will also typically have their initiation methionine removed and in case of proteolytically processed proteins, we can confirm correct cleavage sites.
To show that we have no nucleotide contamination in the sample, we always analyse the protein by measuring its UV spectrum, typically between 340 nm and 220nm. Maximal absorption at 280 nm and a clear dip at 240 nm are typical for protein and even small amounts of nucleotide contamination will be revealed by increased absorption at 260 nm.
UV absorbance at 280 nm is also a very good way to quantify a purified protein, using calculated absorbance coefficient, and in the case of lyophilised samples, we use this to verify that we can recover the expected amount of protein from the vial after reconstitution (you can see these QC assays in use in our datasheets)
After all, if you have a vial that says 50 µg, you’d assume you’d get 50 µg out of it!

Table 1. Activin A summary
Activin A was purchased from five suppliers (please note two proteins from different sources or grades were purchased from suppliers B and C) and reconstituted in 100 µl of filtered MilliQ water per 10 µg of protein to have the maximum volume at the lowest acceptable concentration (0.1 mg / ml) before pooling. Activin A made using the process developed by Hyvonen lab was reconstituted in filtered MilliQ water at 1mg / ml, 20 µg was taken off and diluted to 200 µl. All samples were then dried to powder and stored at -20°C. All samples were reconstituted in 10 mM HCl to final expected protein concentration of 0.5 mg/ml. Protein concentration was determined in triplicate spectrophotometrically by measuring spectrum from 320-220 nm and using scattering corrected absorption at 280 nm. A theoretical absorption coefficient of 18950 AU mol-1 cm-1 was used for the calculation of protein concentration.
Despite all this biochemical and biophysical characterisation, the real proof of the protein’s quality is in its specific bioactivity.
The end use of our proteins is in cellular assays and that is where the protein needs to show what it is made of. We use typically well established and calibrated luciferase reporter assays that allow us to define complete dose-response curve for the protein of interest and define its EC50 value. By knowing what the expected activity for the protein is, and by measuring calibrant alongside each new batch of protein, we can confirm that activity of the protein we provide is exactly the same activity as before. No more, no less. And this is done by reconstituting the protein from a stock vial following the process given on the datasheet so that our data is defined in as close to the conditions you would use as possible.
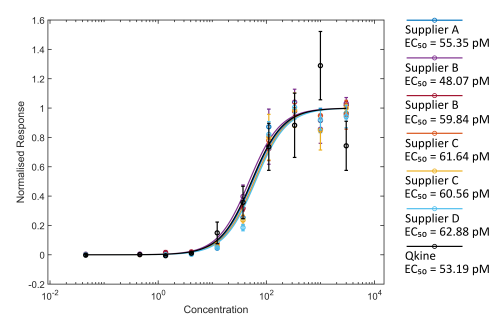
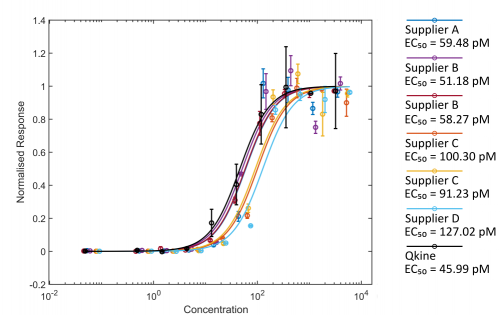
Figure 2. Comparison of Activin A bioactivity from different suppliers using the luciferase reporter assay.
HEK293T cells were transfected with Activin A responsive firefly luciferase and constitutively active Renilla luciferase constructs. Transfected cells were treated with increasing concentration of Activin A diluted in DMEM with 0.5 % v/v FCS in triplicate. Cells were grown overnight and luciferase activity measured by luminescence. Firefly luciferase readings were normalised with Renilla luciferase readings. Activin A concentration was calculated using the measured protein concentration (left hand image) or based on the calculated concentration assuming the amount recovered from the vial matched the amount stated on the vial (right hand).
So, why go to all this trouble?
It is because we want to take away any uncertainty that arises from the use of growth factors. These are the magical components in the cell culture media that are critical to the experiments. But given their low concentration, it is difficult to validate them and testing each batch of protein gets very expensive. Some of these growth factors act as morphogens, ie. their effect on cells is different at different concentrations. 10 ng/ml of Activin A supports pluripotency in hESC, but higher concentrations drive them towards endodermal differentiation. If the active concentration of protein you recover from the vial is different from what you expect, the effect of that protein on the cells can be different.
By defining very strict and robust quality control criteria, we expect to provide proteins that are working exactly the same way, every day, from batch to batch, at any scale you need.
Batches that do not match these strict criteria are not accepted for sale.
Simple as that.